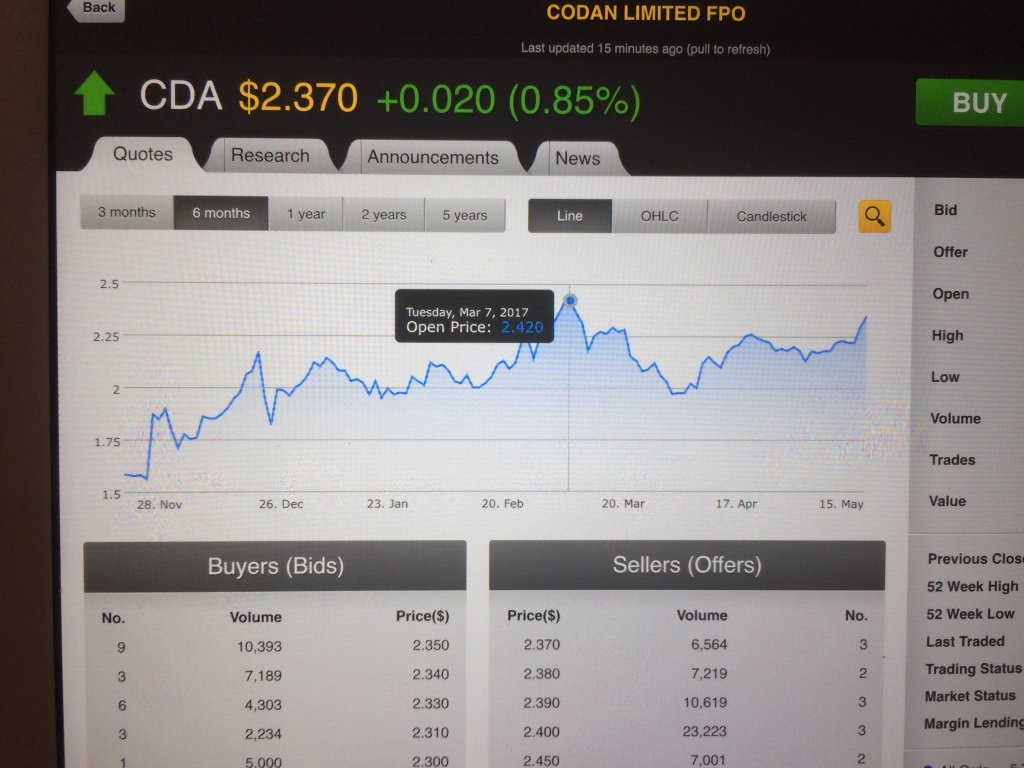
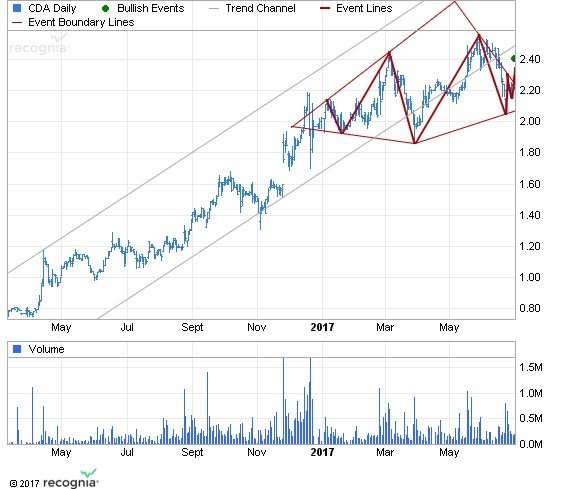
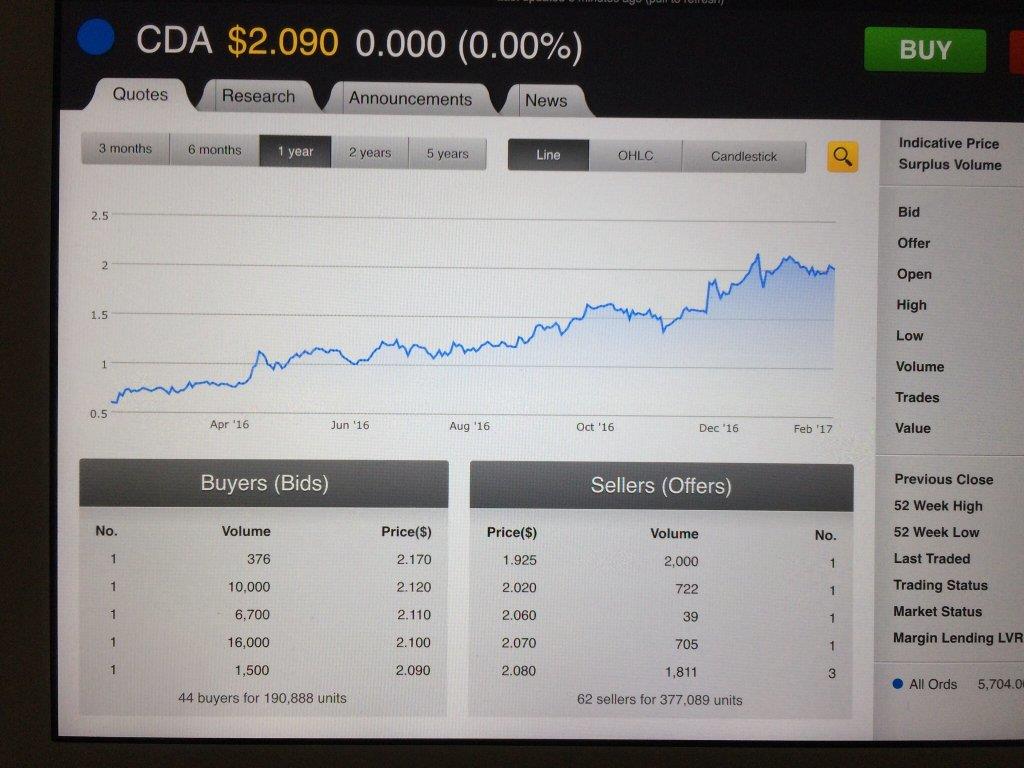
For the last year Codan (cda) share price has been on a beautiful little run from $.58 to $2.09 . This mornings charting has thrown up a possible break up through resistance at $2.17 for the third time . If so a 25 point earn in a month is possible and a not impossible return to the $4 share price of recent years over the longer term should the steam train continue  imho
imho
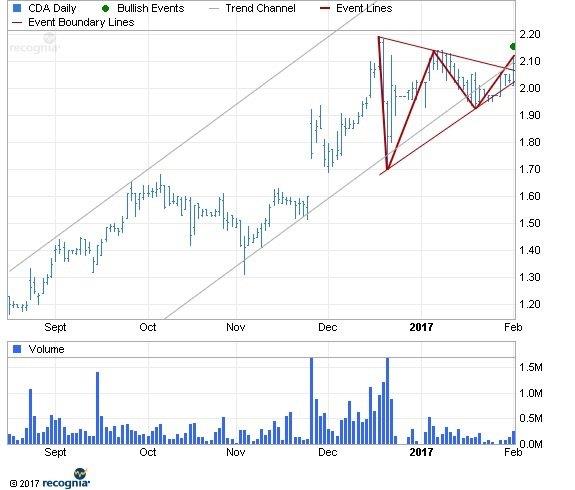
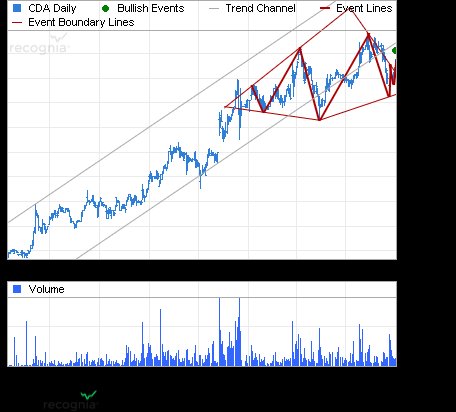
:Codan Ltd forms bullish "Ascending Continuation Triangle" chart pattern
Feb 01, 2017
Xxxxxx has detected an "Ascending Continuation Triangle" chart pattern formed on Codan Ltd (CDA:ASX). This bullish signal indicates that the stock price may rise from the close of 2.09 to the range of 2.51 - 2.61. The pattern formed over 32 days which is roughly the period of time in which the target price range may be achieved, according to standard principles of technical analysis.
Tells Me: The increasingly higher lows and constant highs within this pattern tell us that buyers are more aggressive than sellers, confirmed by a breakout through a resistance level to signal a continuation of the prior uptrend. An Ascending Triangle, with its increasingly higher lows and constant highs, indicates that buyers are more aggressive than sellers. The pattern typically forms because a supply of shares is available at a certain price, represented by the upper flat line. When the supply depletes, the shares quickly break out from the top trendline and move higher.
imho
:Codan Ltd forms bullish "Ascending Continuation Triangle" chart pattern
Feb 01, 2017
Xxxxxx has detected an "Ascending Continuation Triangle" chart pattern formed on Codan Ltd (CDA:ASX). This bullish signal indicates that the stock price may rise from the close of 2.09 to the range of 2.51 - 2.61. The pattern formed over 32 days which is roughly the period of time in which the target price range may be achieved, according to standard principles of technical analysis.
Tells Me: The increasingly higher lows and constant highs within this pattern tell us that buyers are more aggressive than sellers, confirmed by a breakout through a resistance level to signal a continuation of the prior uptrend. An Ascending Triangle, with its increasingly higher lows and constant highs, indicates that buyers are more aggressive than sellers. The pattern typically forms because a supply of shares is available at a certain price, represented by the upper flat line. When the supply depletes, the shares quickly break out from the top trendline and move higher.